
 myCSUSM


CSUSM Voting Stats
Congratulations
CSUSM earned a Gold Seal from the 2020 Election ALL IN Campus Democracy Challenge for non partisan student voter participation efforts.
2020 Voting Rate
(19.2% higher than 2016)
Great job taking action everyone!
CSUSM's 2020 Voter Engagement Report
All Insitutions
2020 Voting rate
2018 Voting Rate
CSUSM
Registration Rate
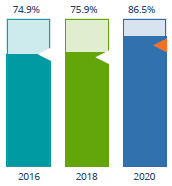
The registration rate is the percent of your voting-eligible students who registered to vote.
- 2016: 74.9%
- 2018: 75.9%
- 2020: 86.5%
Voting Rate of Registered Students
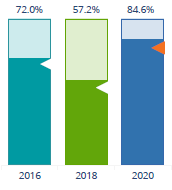
The voting rate of registered students is the percent of registered students who voted on Election Day. We often refer to this as the "Yield" rate.
- 2016: 72.0%
- 2018: 57.2%
- 2020: 84.6%
Voting Rate
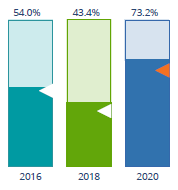
The voting rate is the percentage of eligible students eho voted on Election Day. The voting rate is also the profuct of the registration and yield rates.
- 2016: 54.0%
- 2018: 43.4%
- 2020: 73.2%
Results shown from the National Study of Learning, Voting and Engagement (NSLVE) CSUSM 2020 Campus Report.
2018 | Mid-Term Election CSUSM Voter Registration and Participation Rates
- 2018 Voting Rate: 45.5%
- Change from 2014: +29.5
- 2018 Voting Rate for all institutions: 39.1%
Registration Rate

- 2014: 61.9%
- 2018: 73.6%
Voting Rate of Registered Students

- 2014: 25.8%
- 2018: 61.8%
Voting Rate

- 2012: 54.2%
- 2016: 52.1%
Results shown from the National Study of Learning, Voting and Engagement (NSLVE) CSUSM 2014 & 2018 Campus Report.
2016 | Presidential Election Year CSUSM Voter Registration and Participation Rates
- 2016 Voting Rate: 52.1%
- Change from 2012: -2.2%
- 2016 Voting Rate for all institutions: 50.4%
Registration Rate
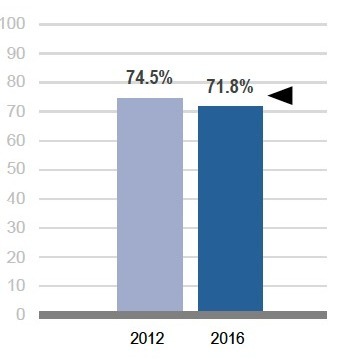
- 2012: 74.5%
- 2016: 71.8%
Voting Rate of Registered Students
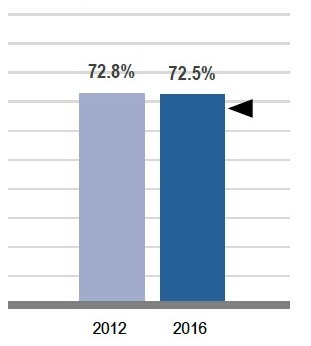
- 2012: 72.8%
- 2016: 72.5%
Voting Rate
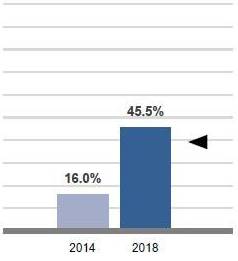
- 2014: 16.0%
- 2018: 4535%
Results shown from the National Study of Learning, Voting and Engagement (NSLVE) CSUSM 2012 & 2016 Campus Report.