 myCSUSM


Waste Trends
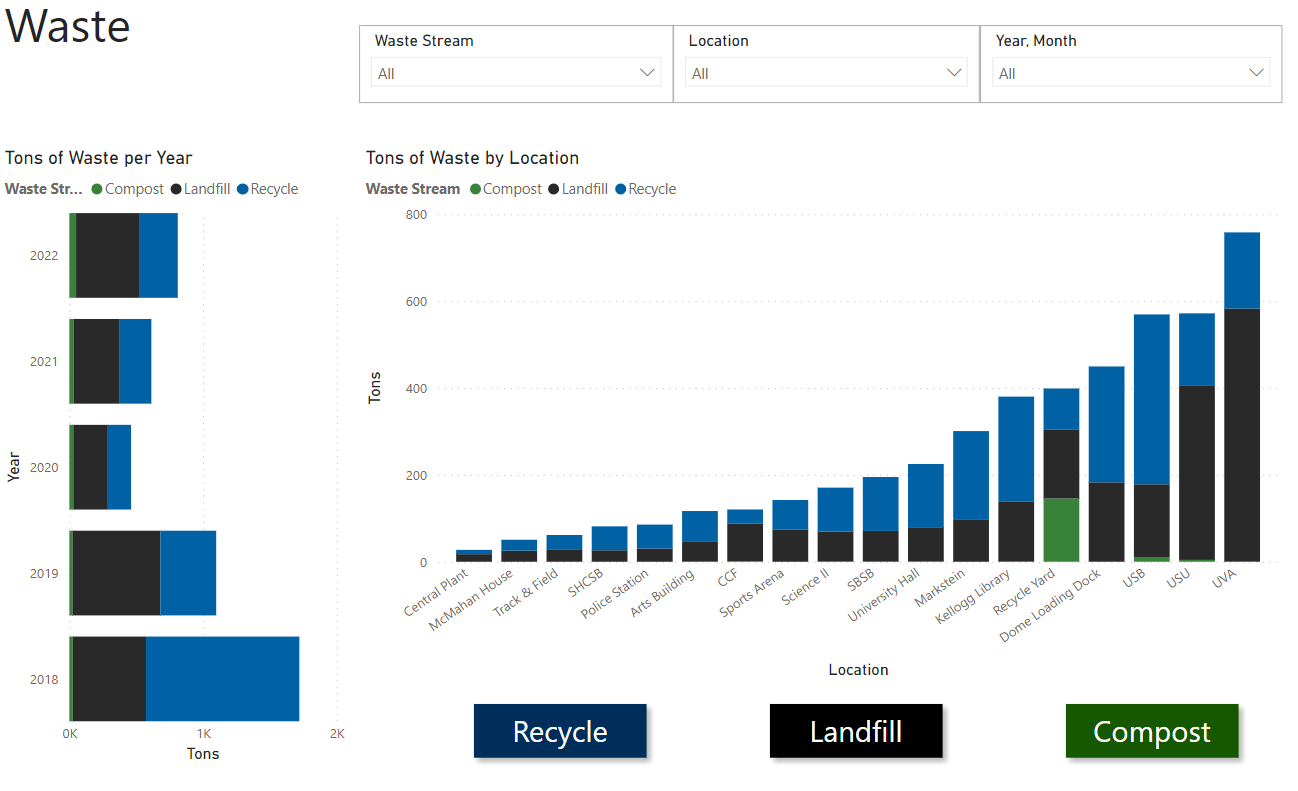
Current Waste Trends through Power BI
Current waste trends at CSUSM can be viewed via our Power BI dashboard. The waste dashboard summarizes historical data of CSUSM's waste output and is considered complex data. If any assistance is needed to help break down the data into a more consumable format, or for any other accessibility need, please contact us at sustainability@csusm.edu.
Previous Waste Trends
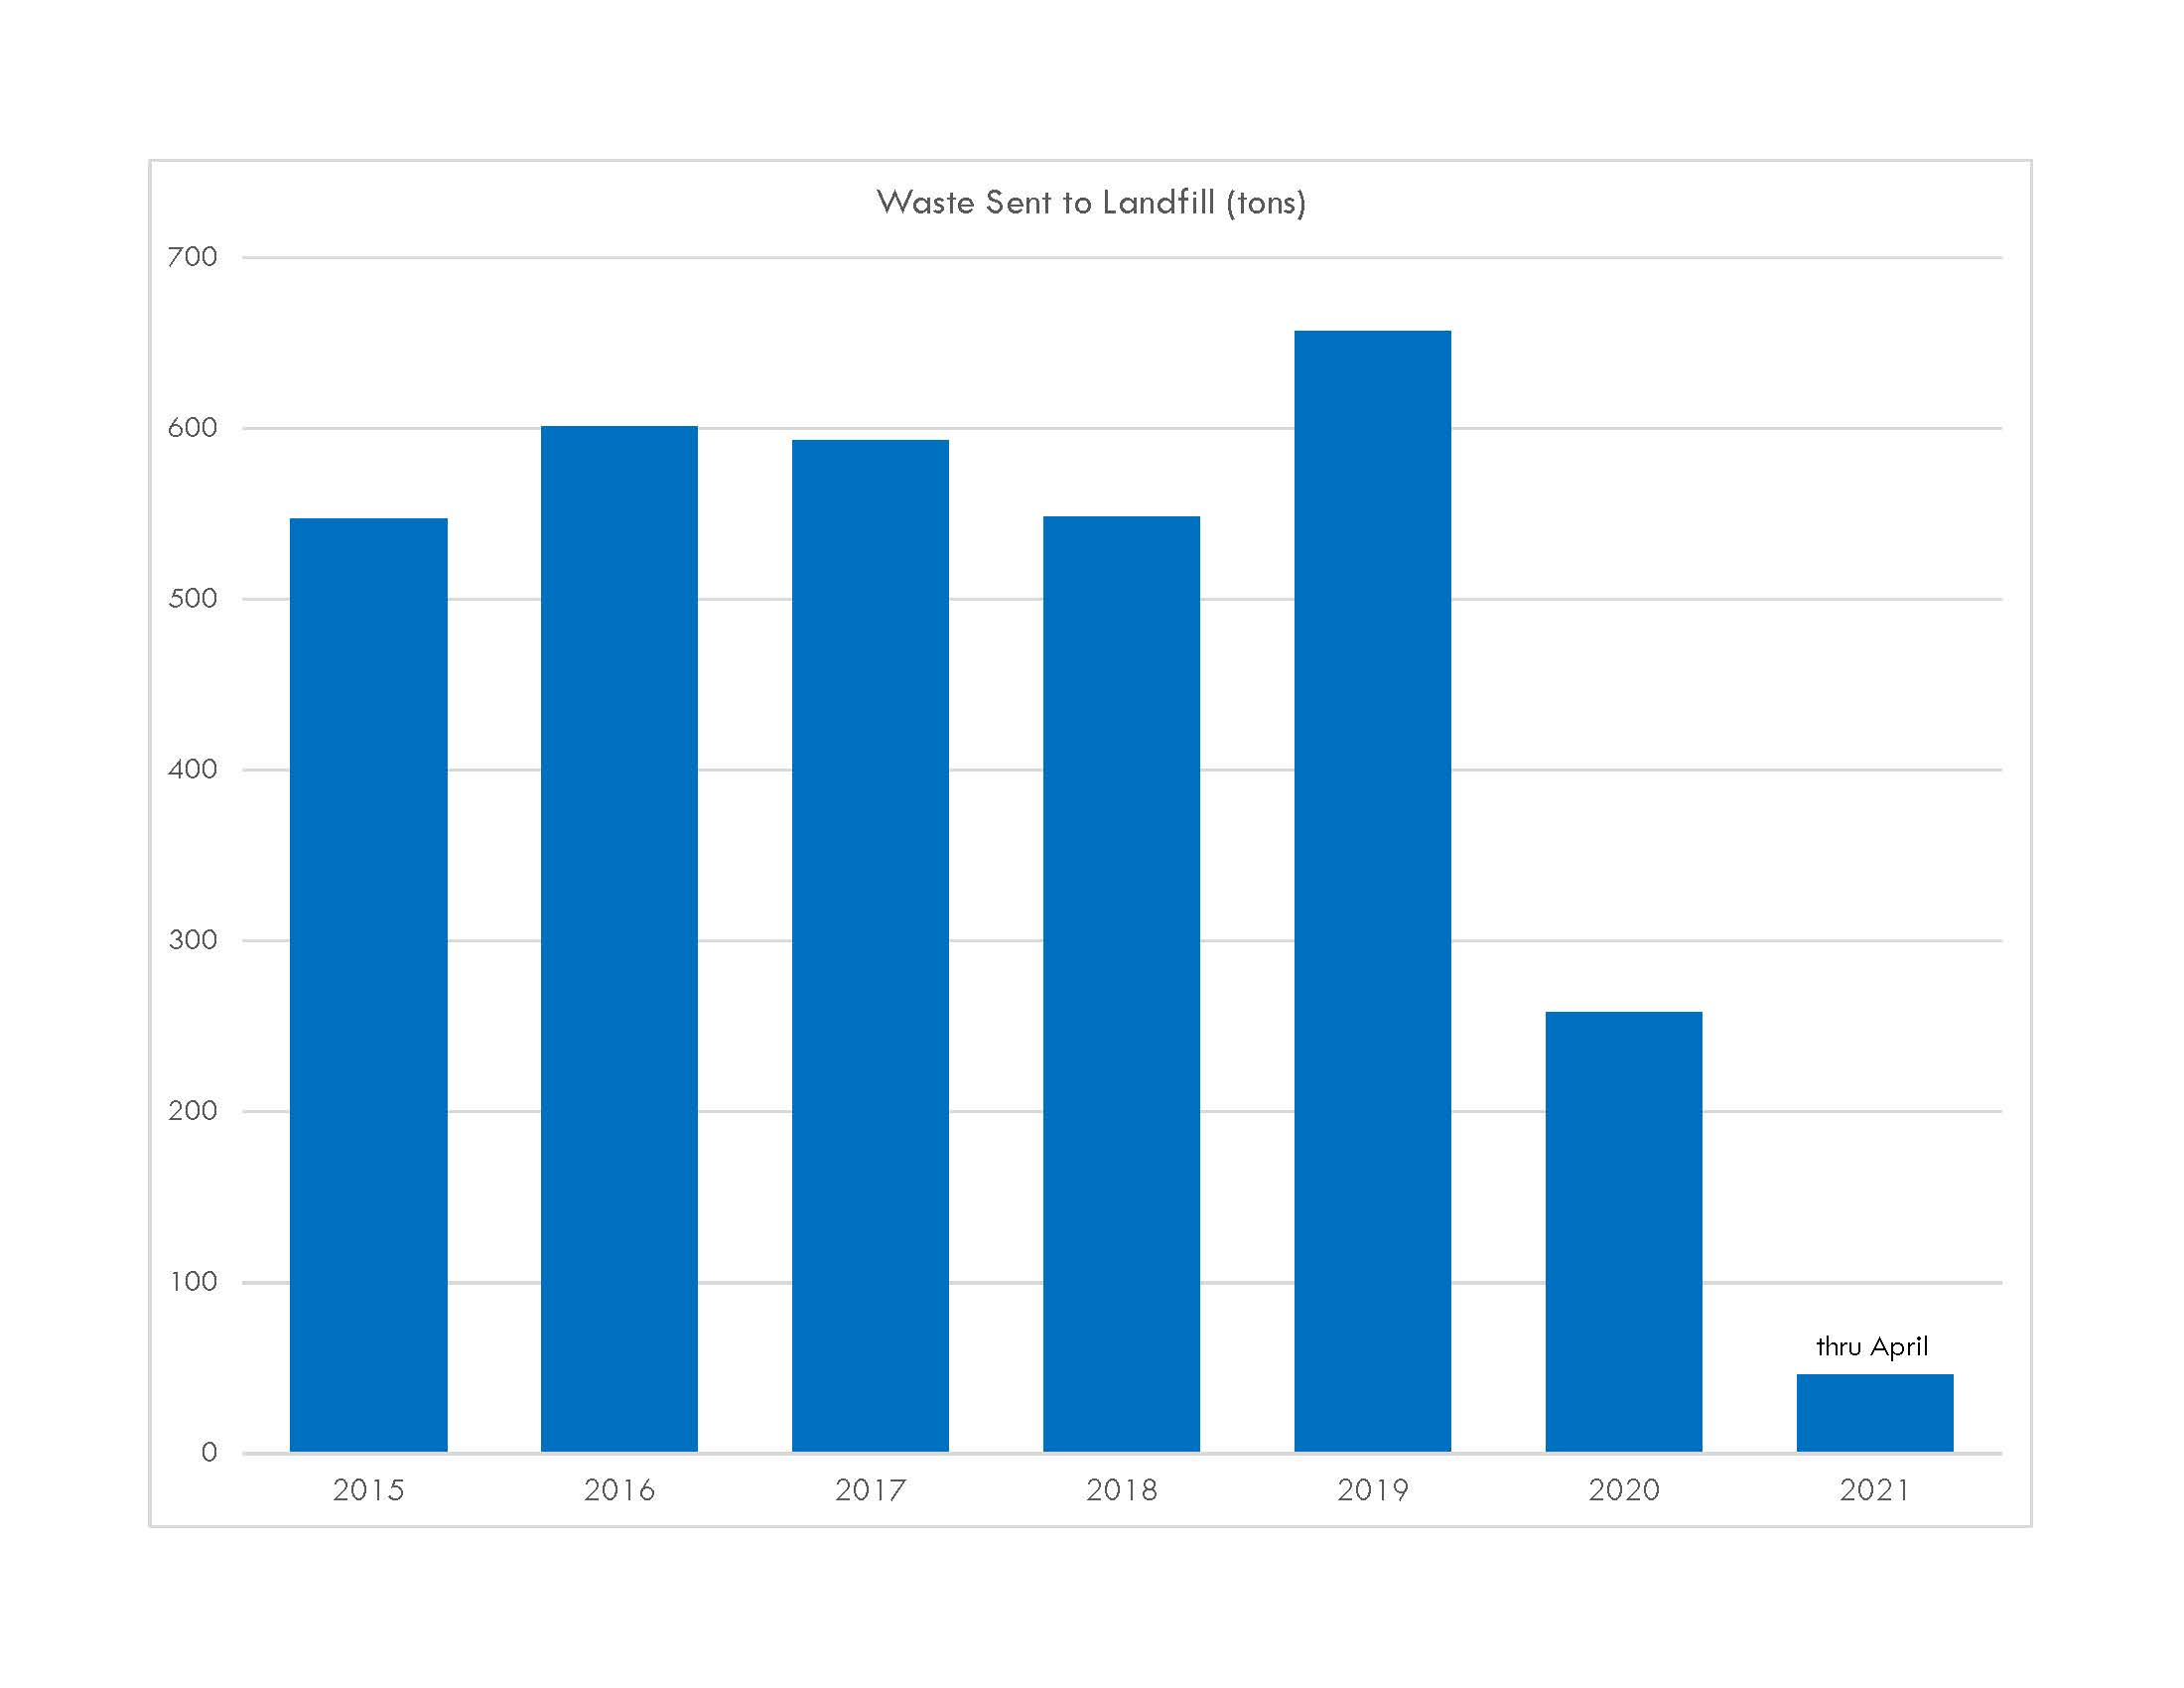
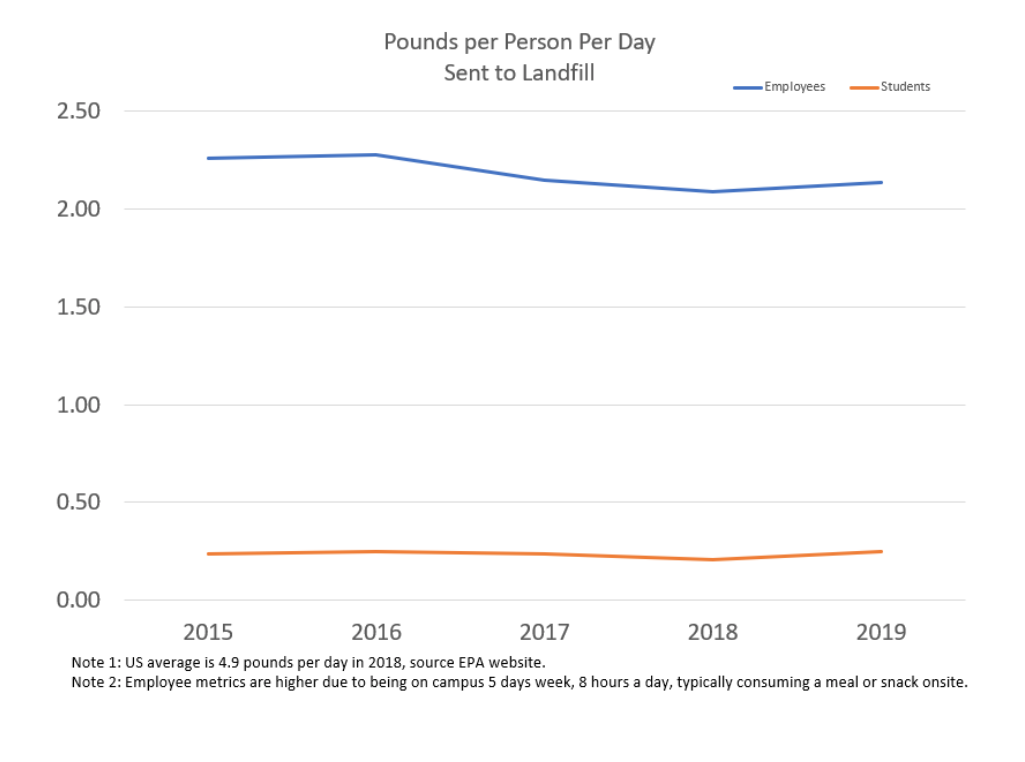
As part of our Zero Waste by 2025 goal, we tracked down how much “waste” material leaves campus. In 2015, over 2,100 tons of waste and recycled material left campus, increasing each year as our campus population grew. In 2018, we reduced our tonnage to less than 1,800 tons. Less material was sent to the landfill and diverted material tonnage was also reduced (significantly due to a benchmark update by our waste hauler). Additionally, our programming efforts overall have increased.