
 myCSUSM


Energy Consumption Trends
CSUSM Utility and Waste Metrics Over Time
Electricity
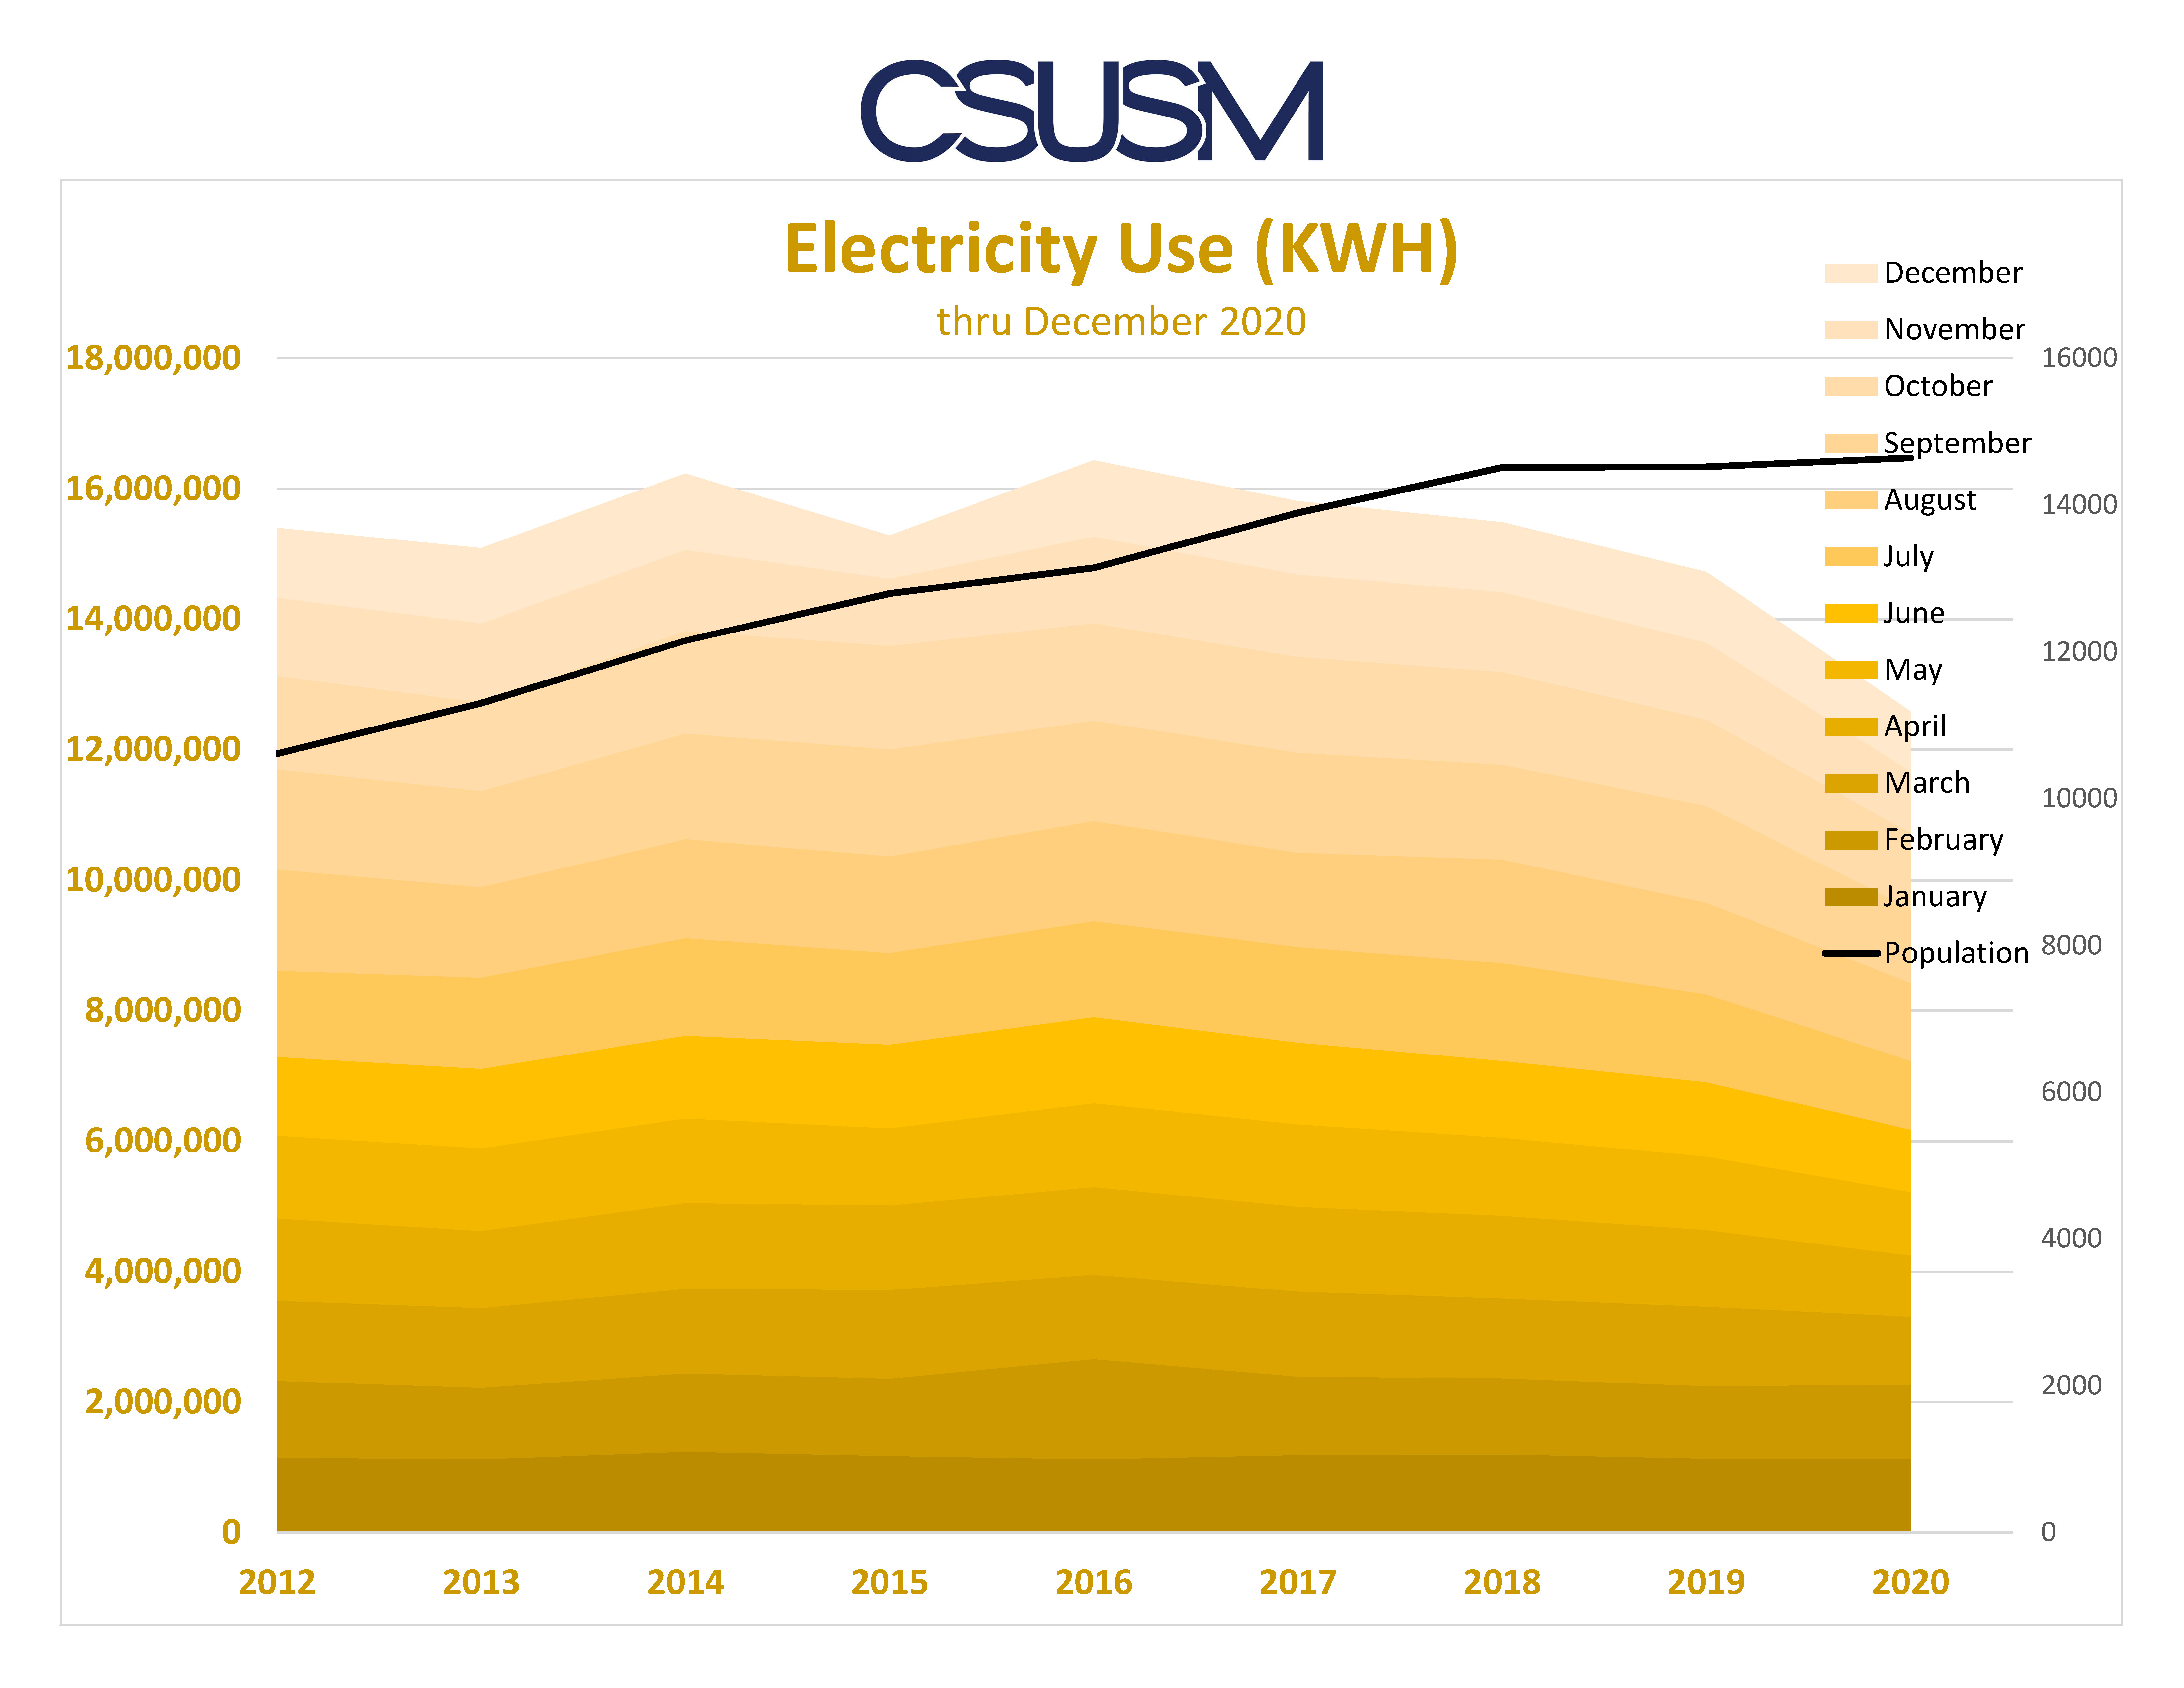
Graph trend at a glance: Despite a growing population, electricity usage has decreased.
- In 2012, there was a population of 11,000 and an overall usage of 15,000,000 electricity (KWH)
- In 2020, there was a population of 15,000 and an overall usage of 13,000,000 electricity (KWH)
Gas
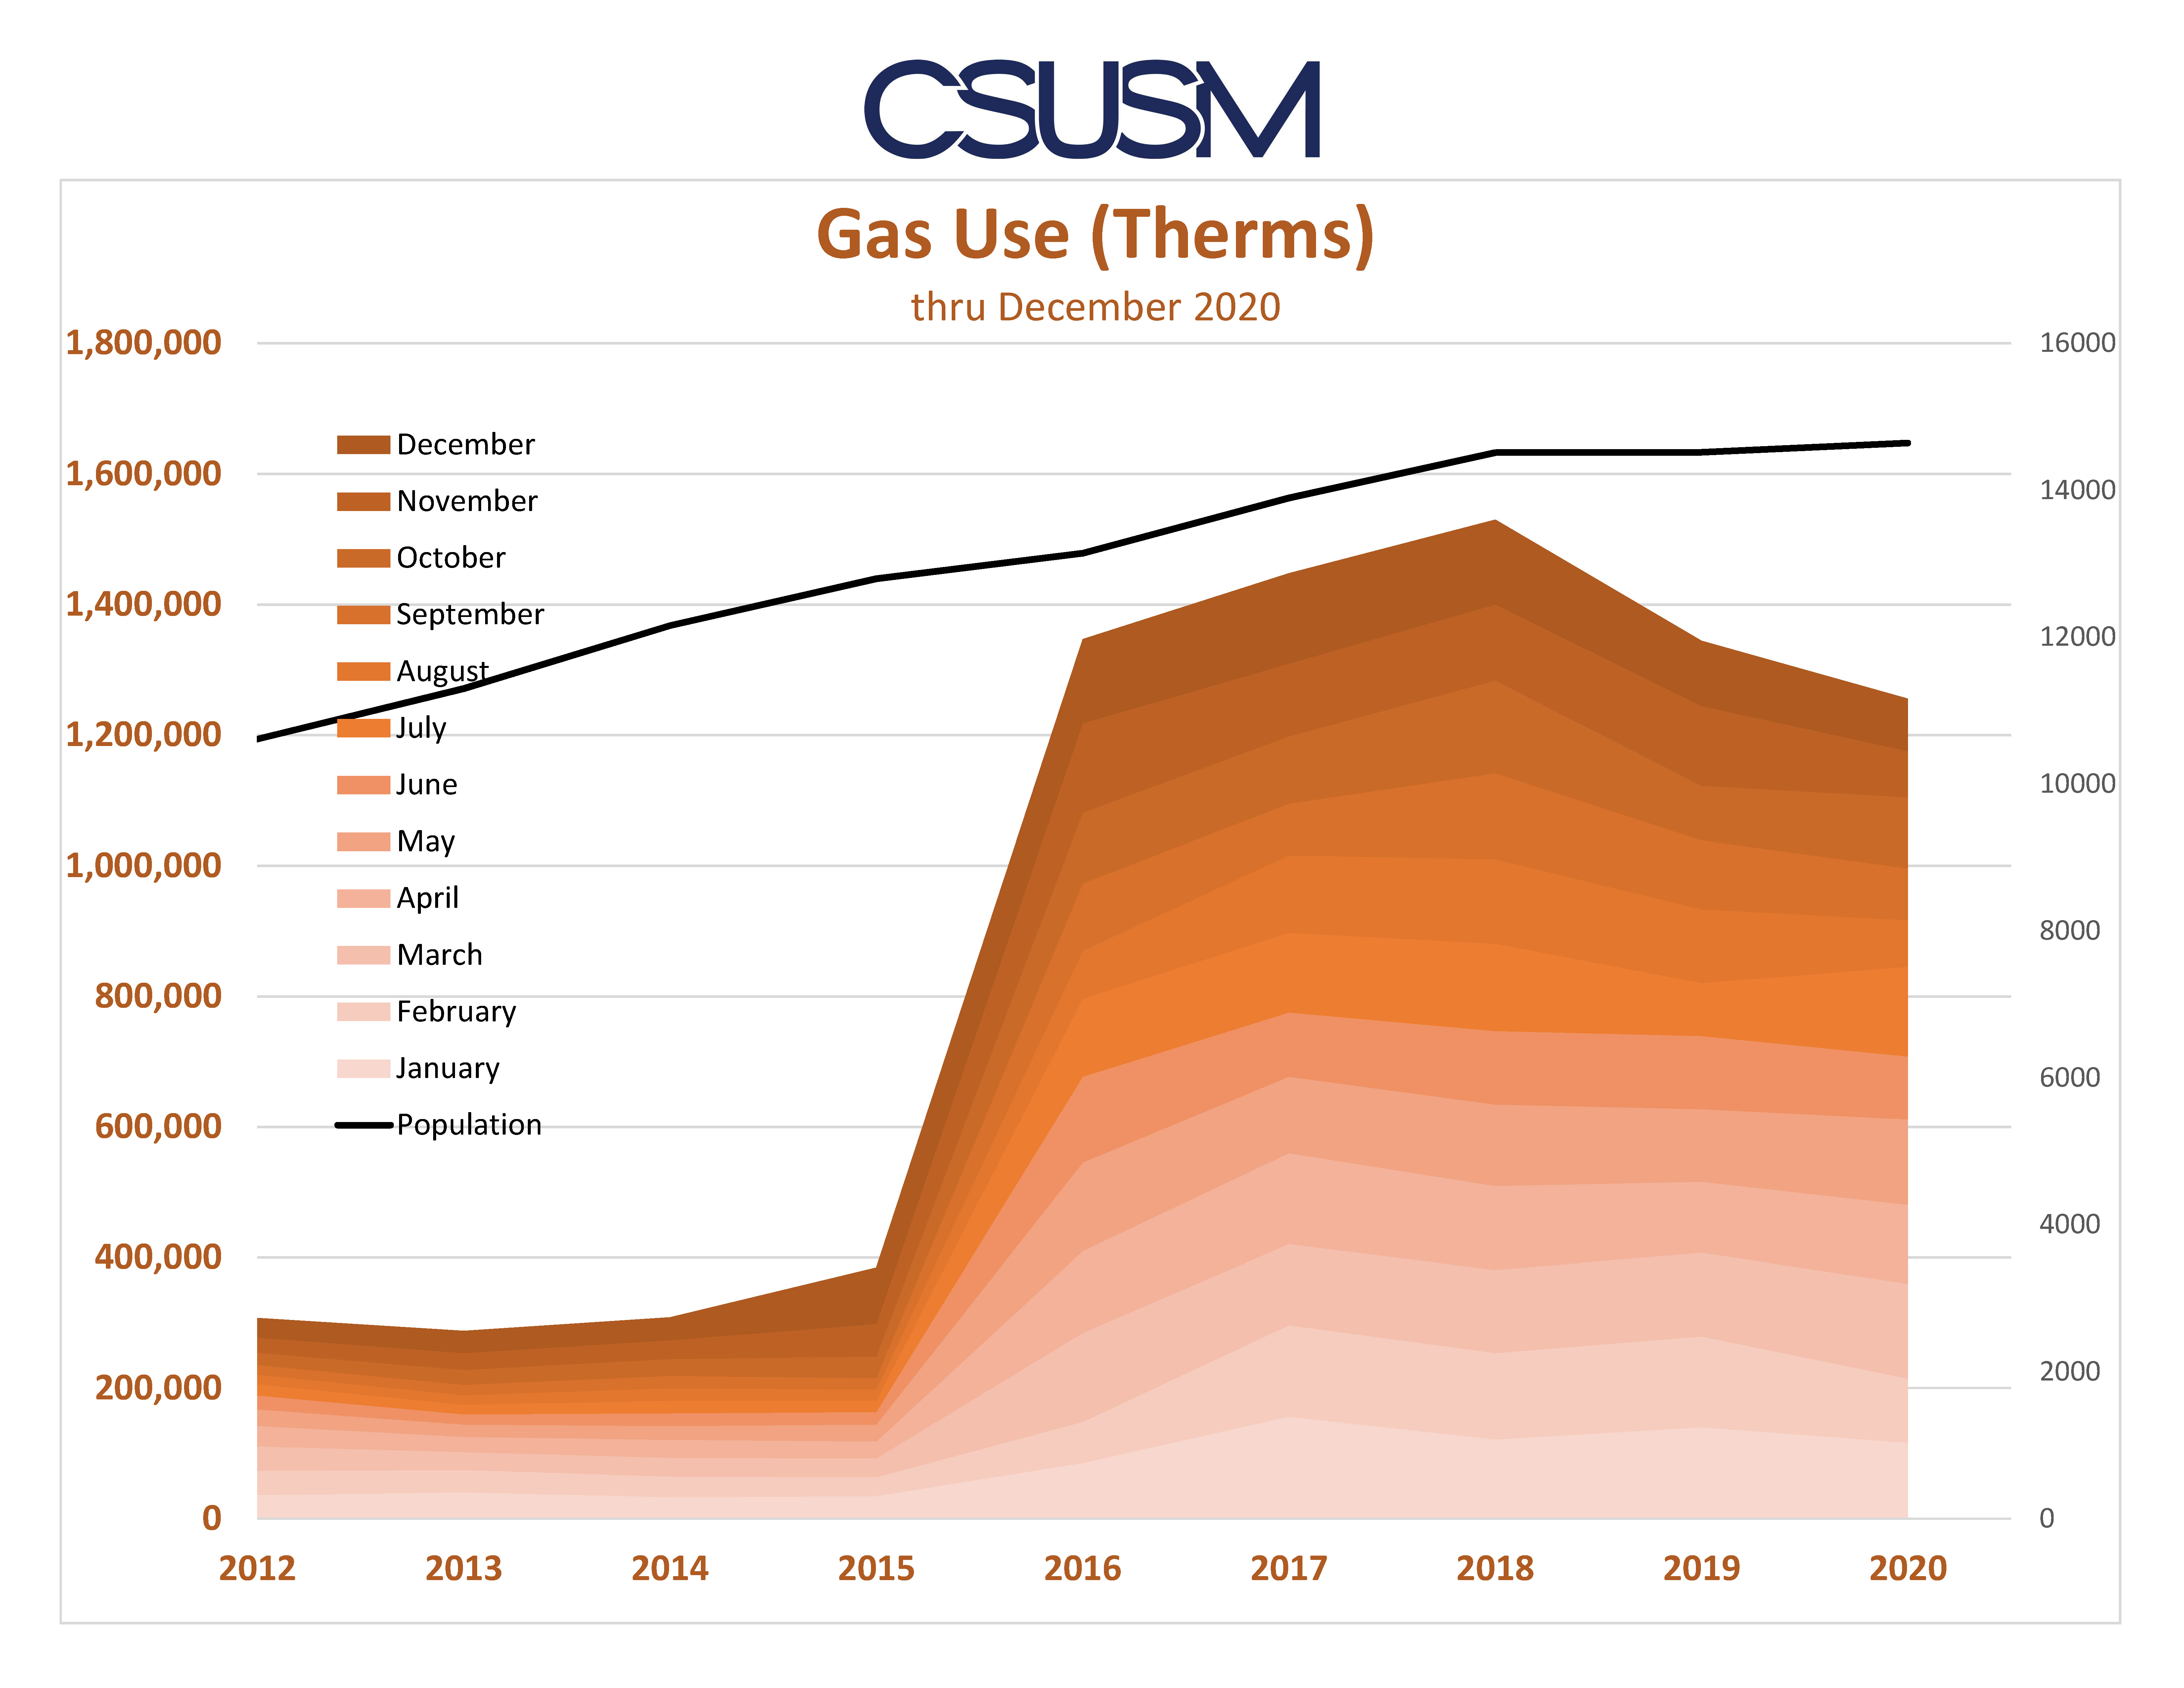
Graph trend at a glance: Gas usage has increased with the campus's population increase.
- In 2012, there was a population of 11,000 and an overall usage of 300,000 gas (Therms)
- In 2020, there was a population of 15,000 and an overall usage of 1,300,000 gas (Therms)
Water
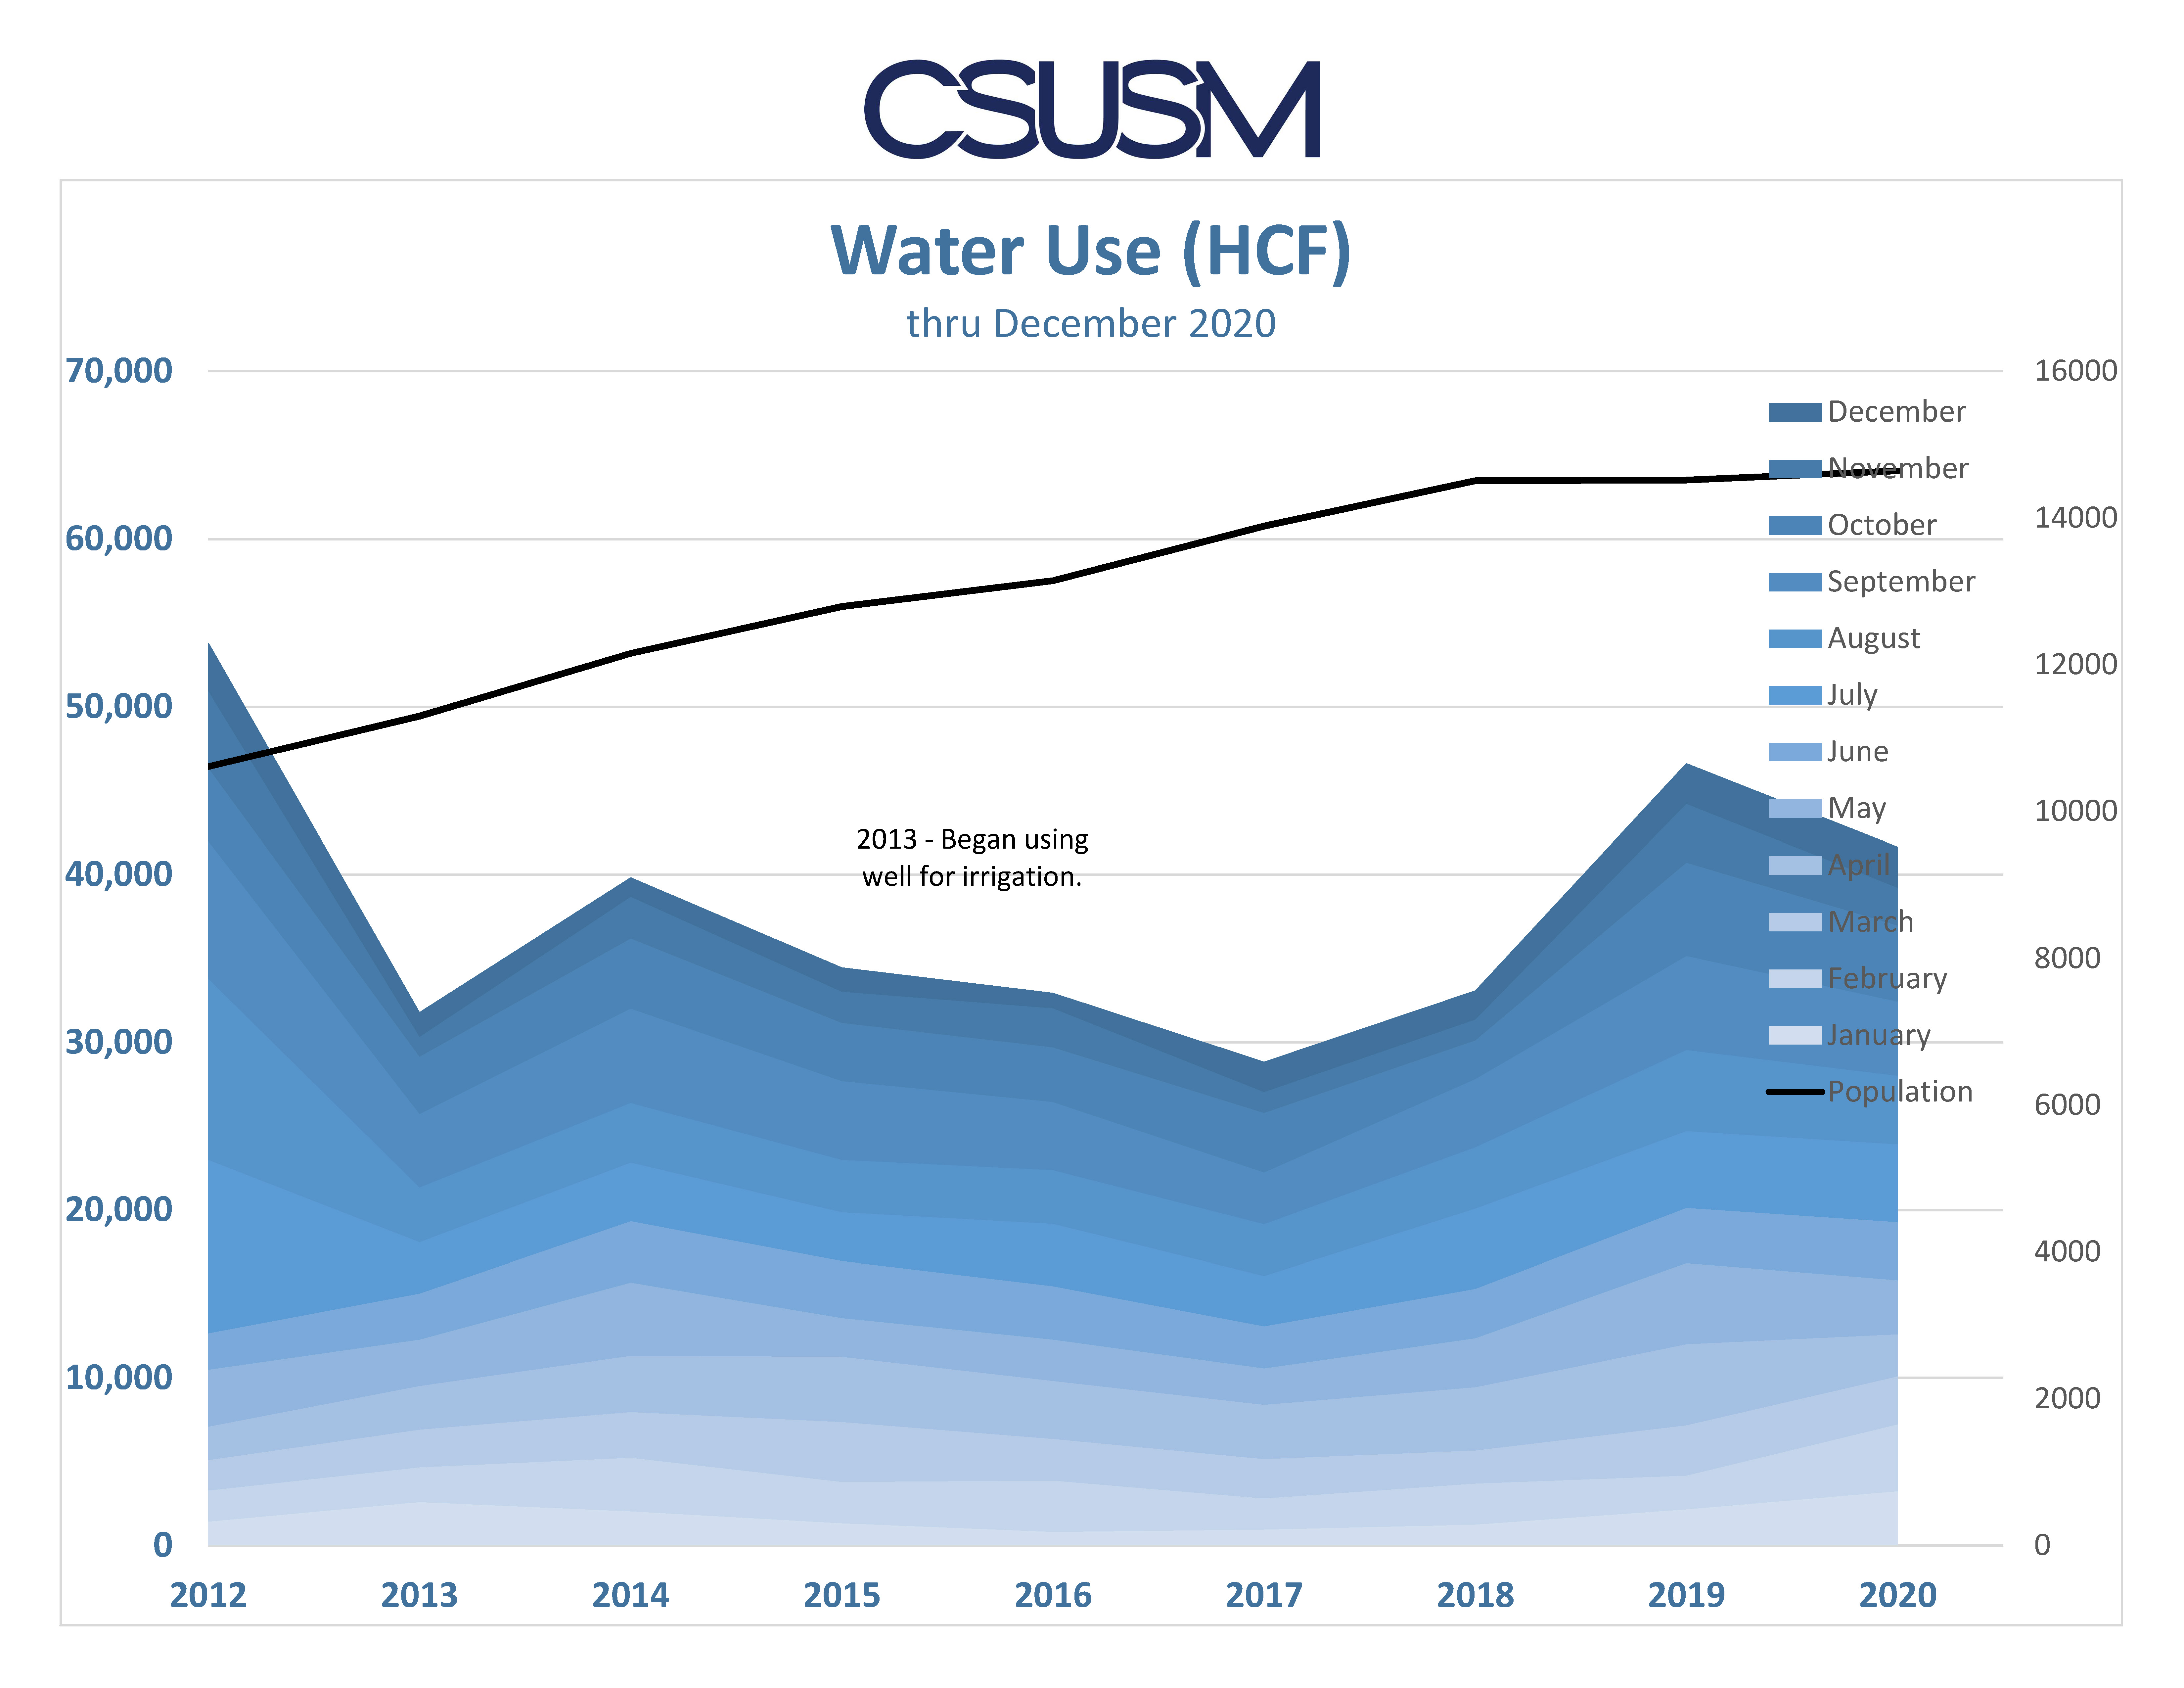
Graph trend at a glance: Water usage has stayed mostly consistent with the campus's population increase.
- In 2012, there was a population of 11,000 and an overall usage of 54,000 water (HCF)
- In 2020, there was a population of 15,000 and an overall usage of 42,000 water (HCF)