
 myCSUSM


Flow Charts
What is a flow chart?
Flowcharts visually guide readers through a complex process/procedure that have many potential endpoints.
Flow charts can help users make decisions about a complex issue and can be a very
valuable communication tool. While not a common web element, flow charts are sometimes
helpful to have on a webpage; if creating a flow chart however, some additional steps
will be necesary.
Why are flow charts problematic?
Flow charts depict visually complex information and is not accessible for non-visual readers. Additionally, some people may prefer to read through a process in a textual way to help understand the overall process.
How to make an accessible flowchart?
Pair a flow chart graphic with well formatted text
Summarize the flowchart in a well formated text-only version directly on your webpage. Use headings, ordered lists, and unordered lists to organize decisions and steps. Learn more about headings.
Design the flow chart graphic
Once you have your outline, design a flowchart image that represents your process.
- Keep the graphic simple
- Use accessible colors and fonts: CSUSM requires all color combinations to be a 4.5:1 or higher ratio - check your color combinations.
- Save the flow chart graphic as a .png, .jpg, or .jpeg image
- Upload the flow chart image to your webpage, then add in alternative text that concisely summarizes your flowchart. For the lamp flow chart example below, the alt text reads "lamp doesn't work troubleshooting flowchart".
Accessible Flow Chart Example
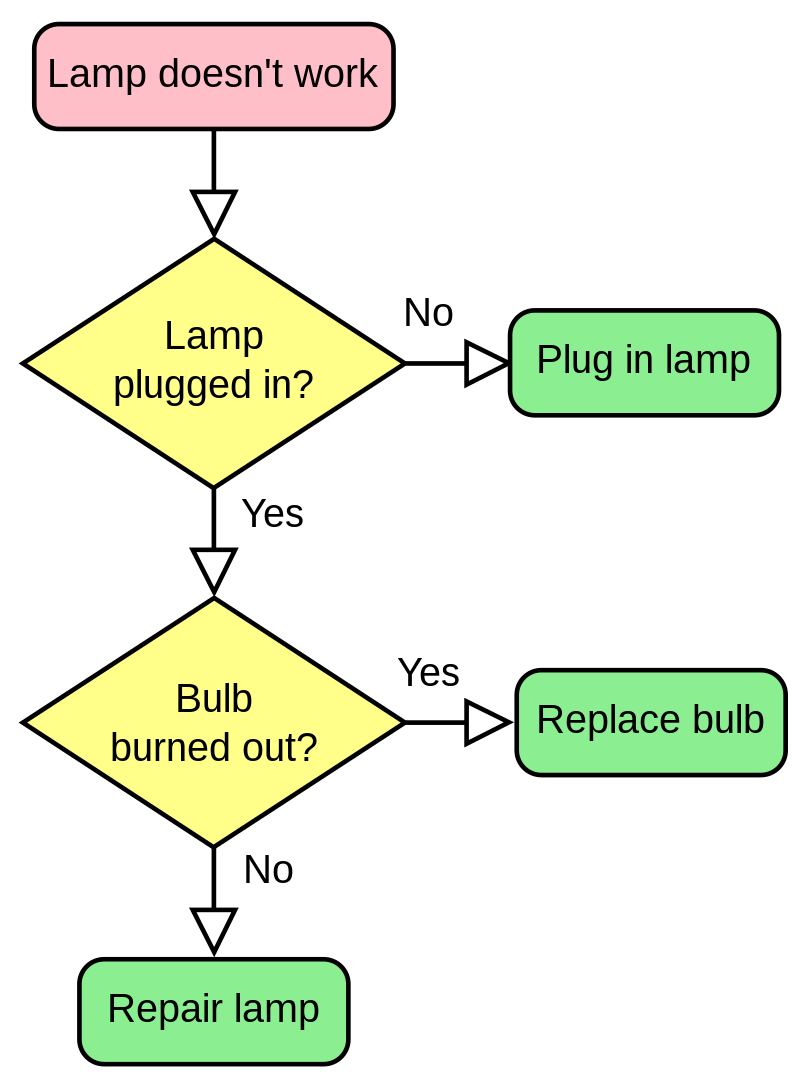
Problem: The lamp doesn't work
Step 1: Is the lamp plugged in?
- If yes, proceed to the process in step 2.
- If no, plug the lamp in. Recheck to see if lamp turns on.
Step 2: Is the bulb burnt out?
- If yes, replace the bulb.
- If no, repair the lamp.