 myCSUSM


Quiz Results and Statistics
The quiz statistics report may be viewed by clicking on the quiz and then accessing
Administration > Quiz administration> Results > Statistics. The full report (overview,
and detailed analysis of all questions) can be downloaded in a variety of formats,
as can the quiz structure analysis table.
This report gives a statistical analysis of the quiz, and the questions within it.
The top section of this report gives a summary of the whole quiz. The next section
gives an analysis showing all questions in a table format. There are links in this
section to edit individual questions or drill down into a detailed analysis of a particular
question. The last section is a bar graph of the percent of correct answers (Facility
index) and the Discriminative efficiency index.
QUIZ INFORMATION SECTION
This section gives some basic information about the test as a whole. You will see:
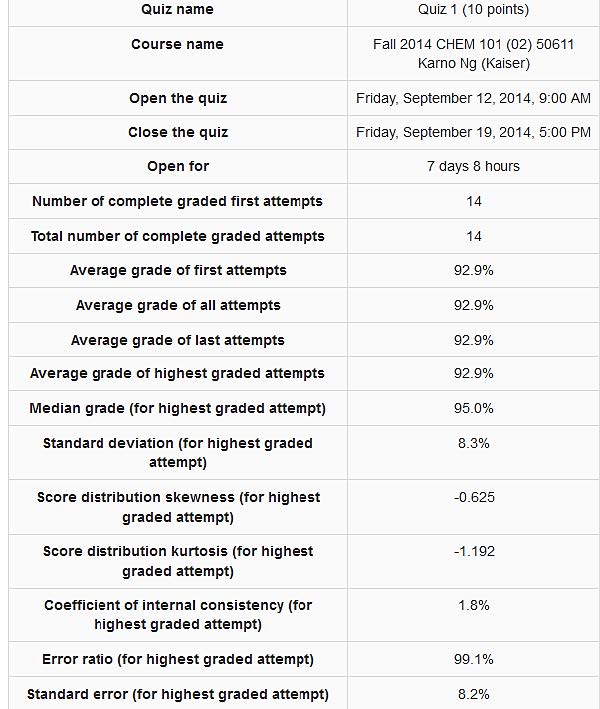
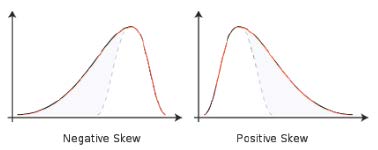
SKEWNESS:
A measure of the asymmetry of the distribution of scores. Zero implies a perfectly
symmetrical distribution, positive values a ‘tail’ to the right and negative values
a ‘tail’ to the left.
Aim for a value of -1.0. If it is too negative, it may indicate lack of discrimination between students who do better than average. Similarly, a large positive value (greater than 1.0) may indicate a lack of discrimination near the pass fail border.
KURTOSIS:
Kurtosis is a measure of the flatness of the distribution. A normal, bell shaped, distribution has a kurtosis of zero. The greater the kurtosis, the more peaked is the distribution, without much of a tail on either side. Aim for a value in the range 0-1. A value greater than 1 may indicate that the test is not discriminating very well between very good or very bad students and those who are average.
COEFFICIENT OF INTERNAL CONSISTENCY (sometimes called Cronbach Alpha) - This is a measure of whether all the items in the quiz are testing basically the same thing. Thus it measures the consistency of the text, which is a lower bound for the validity. Higher numbers here are better. It is impossible to get internal consistency much above 90%. Anything above 75% is satisfactory. If the value is below 64%, the test as a whole is unsatisfactory and remedial measures should be considered.
A low value indicates either that some of the questions are not very good at discriminating between students of different ability and hence that the differences between total scores owe a good deal to chance or that some of the questions are testing a different quality from the rest and that these two qualities do not correlate well – i.e. the test as a whole is inhomogeneous.
ERROR RATIO - the variation in the grades comes from two sources. First some students are better than others at what is being tested, and second there is some random variation. We hope that the quiz grades will largely be determined by the student's ability, and that random variation will be minimised. The error ratio estimates how much of the variation is random, and so lower is better. Values of ER in excess of 50% cannot be regarded as satisfactory: they imply that less than half the standard deviation is due to differences in ability and the rest to chance effects.
STANDARD ERROR - this is derived from the error ratio, and is a measure of how much random variation there is in each test grade. So, if the Standard error is 10%, and a student scored 60%, then their real ability probably lies somewhere between 50% and 70%. The smaller the value of SE the better the iCMA, but it is difficult to get it below 5% or 6%
QUIZ STRUCTURE ANALYSIS
This section lists all the questions in the quiz with various statistics in a table
format.
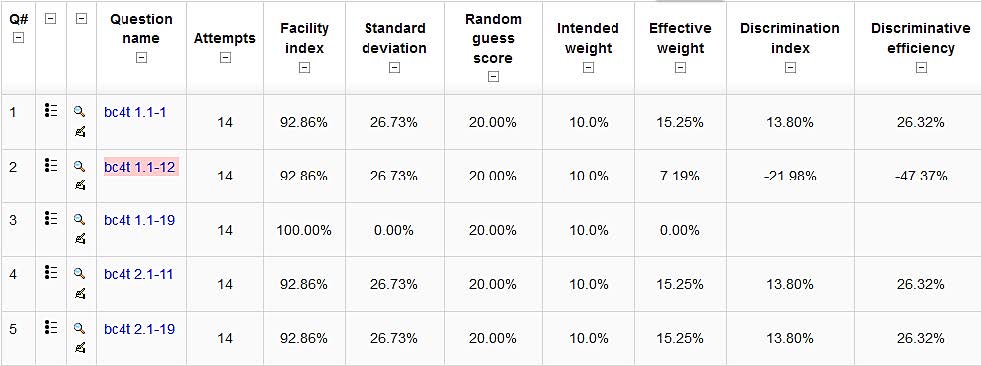
Q# - shows the question number (position), question type icon, and preview and edit
icons
QUESTION NAME - the name is also a link to the detailed analysis of this question
(See Quiz Question Statistics below).
ATTEMPTS - how many students attempted this question.
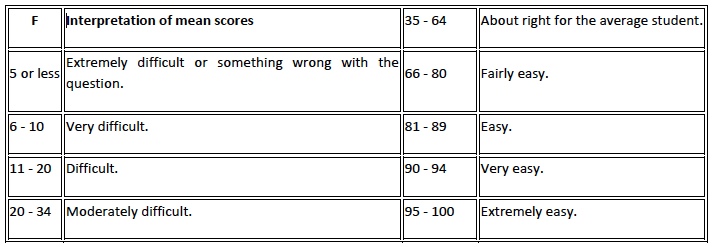
FACILITY INDEX – The mean score of students on the item.
STANDARD DEVIATION – A measure of the spread of scores about the mean -how much variation there was in the scores for this question, and hence the extent to which the question might discriminate. A smaller value suggests that scores are too bunched up, however, if the Facility index is very high or very low, it is impossible for the spread to be very large.
RANDOM GUESS SCORE - the score the student would get by guessing randomly
INTENDED/EFFECTIVE WEIGHT - Intended weight is simply what you set up when editing
the quiz. If question 1 is worth 3 marks out of a total of 10 for the quiz, the intended
weight is 30%. The effective weight is an attempt to estimate, from the results, how
much of the actual variation was due to this question. So, ideally the effective weights
should be close to the intended weights. If the effective weight is greater than the
intended weight it shows the question has a greater share in the spread of scores
than may have been intended. If it is less than the intended weight it shows that
it is not having as much effect in spreading out the scores as was intended.
DISCRIMINATION INDEX - this is the correlation between the score for this question
and the score for the whole quiz. It indicates how effective the question is at sorting
out able students from those who are less able. That is, for a good question, you
hope that the students who score highly on this question are the same students who
score highly on the whole quiz. Higher numbers are better.
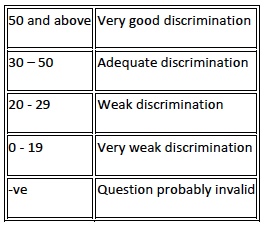
DISCRIMINATIVE EFFICIENCY - another measure that is similar to Discrimination index.
Where random questions are used, there is one row in the table for the random question,
followed by further rows, one for each real question that was selected in place of
this random question.
When quiz questions are randomized for each quiz, the quiz module determines a default
position.
QUIZ QUESTION STATISTICS
Navigation > quiz's name > Results > Statistics (click on any question title) It is possible to see the statistics for one question on a single page. This view will also tell you what percentage of quiz takers selected each answer (Analysis of responses) and give you basic information about the question.
• Question information- The basic information about the question, the name of the
quiz, the question, the question type, the position in the quiz and the question itself.
There are preview and edit icons in this page.
• Question statistics - This repeats the information from the table row from the Quiz
structure analysis that relates to this question.
• Report options - You can choose whether to run the report on all attempts, or just
the first attempt by each student. Some of the calculations used in the report are
based on assumptions that may not apply to quizzes that allow more than one attempt.
Tip: Computing the statistics takes some time, the report will store the computed values and re-use them for up to 15 minutes. Therefore, there is a display of how recently the statistics were calculated, with a button to recalculate them immediatey.
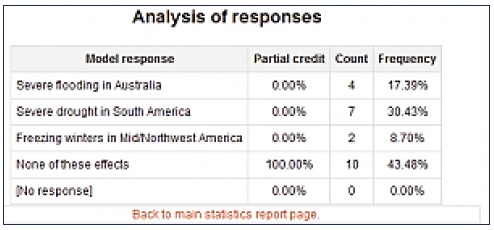
ANALYSIS OF INDIVIDUAL QUESTION RESPONSES
This gives a frequency analysis of the different responses that were given to each part of the question. The details of the analysis depends on the question type, and not all question types support this. For example, essay question responses cannot be analyzed.